
823 Final Project
Covid-19 Daily Case and Death Prediction
Team Member: Caihan Wang, Yifeng Tang, Yuxuan Chen
Website Source:
Executive Summary
In this project, our goal was to predict the daily number of COVID-19 confirmed cases and deaths over a week. Compared to XGBoost, Random Forest model was our final choice considering it had lower RMSE. In this way, our final outputs were 14 Random Forest models, 7 for daily deaths forecast of future 7 days respectively and for daily confirmed cases forecast of future 7 days. In addition, we validated our models by forecasting the daily death and daily cases from Nov 15 2021 to Nov 21 2021 and got acceptable results.
Introduction and Data
Starting from 2020, we humans have been deeply disturbed by Covid-19 disease. In this circumstance, the number of daily cases and daily deaths could be extremely important for us to deal with this pandemic.
We got the daily case and daily deaths data from the CDC website. Besides that, we also collected some socioeconomic data so that we can get more comprehensive prediction results. For state based predictors, we began by adding the population of each state, which should be reasonable because the diffusion of Covid-19 should be highly related with population, especially the absolute number of daily cases. Then, other population related data were also added, those predictors included: population above poverty level in the past 12 months, population with no health insurance, population with over 65 age, population with over 25 age, population density, population with a college degree and employed population. We also believed hospital information would be another important factor for Covid-19, so we included data on the ratio of people to hospital employees and the ratio of people to hospitals. Economic factors would also likely play a role in covid cases, so 2020 GDP and median income were also included. We also gathered restriction policies for Covid-19 in each state and the census region and census division each state belonged to. In addition, we also gathered the potential useful temporal predictors of vaccination numbers and covid-19 test numbers.
Besides, we extracted data from Nov 15 2021 to Nov 21 2021 as validation dataset to show the performance of our model.
Exploratory data analysis
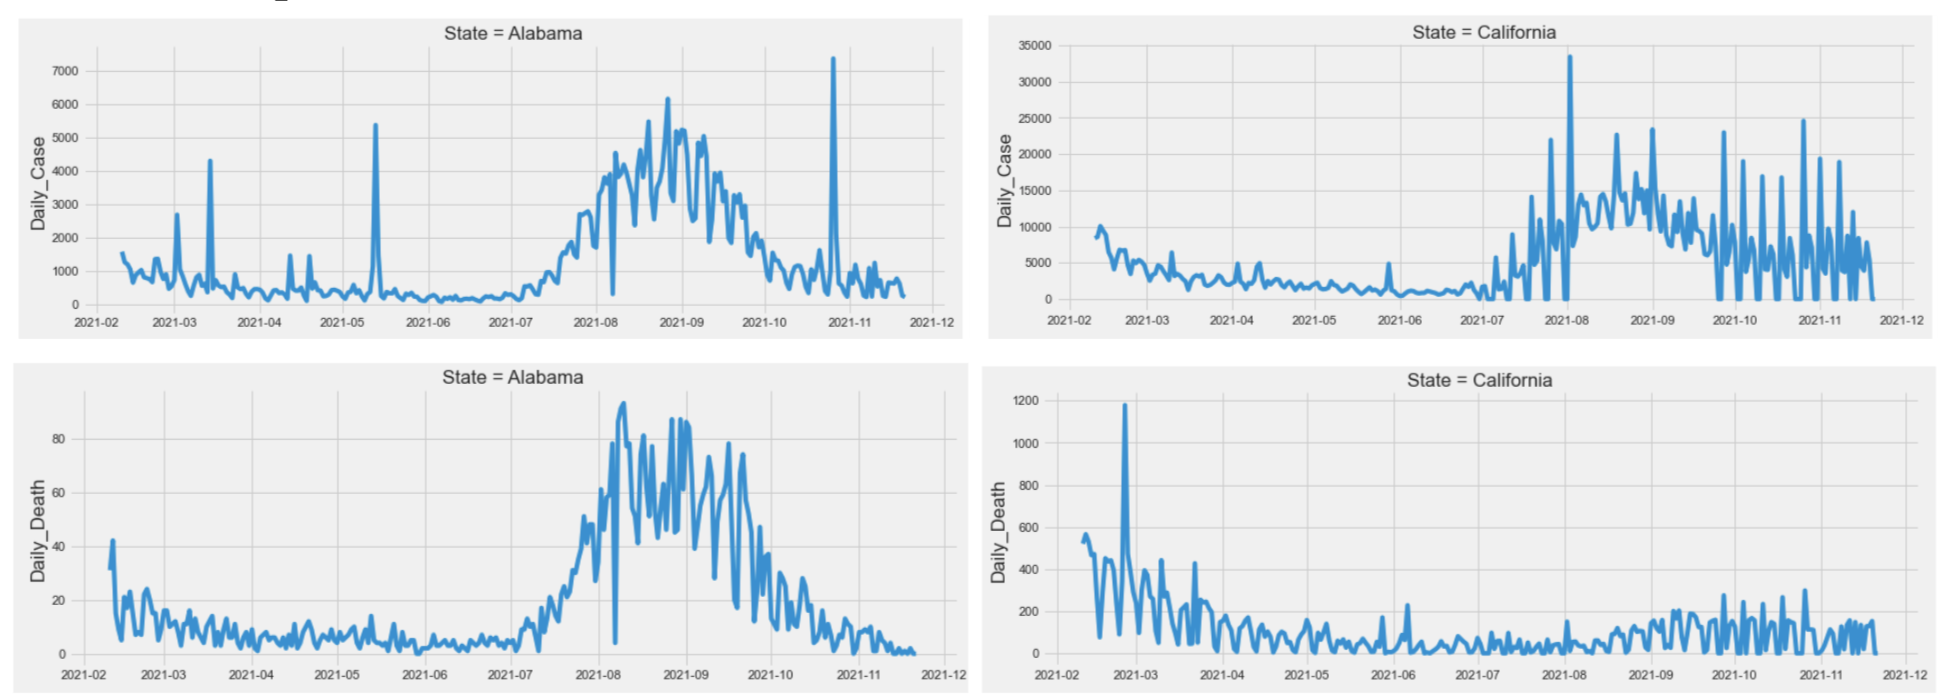
Given that the Covid-19 cases and deaths were time-series data, we first plotted the number of daily confirmed cases and deaths against the timeline for each state. Based on the plot below, which shows a subset of the 51 states (D.C included), we found that both case data and death data had some similar patterns between states, but overall each state had its own unique trend. We also found the number of cases and deaths seemed to be cyclical and followed a weekly pattern. All our findings led us to include each states’ past covid case numbers and death numbers as a predictor for future numbers.
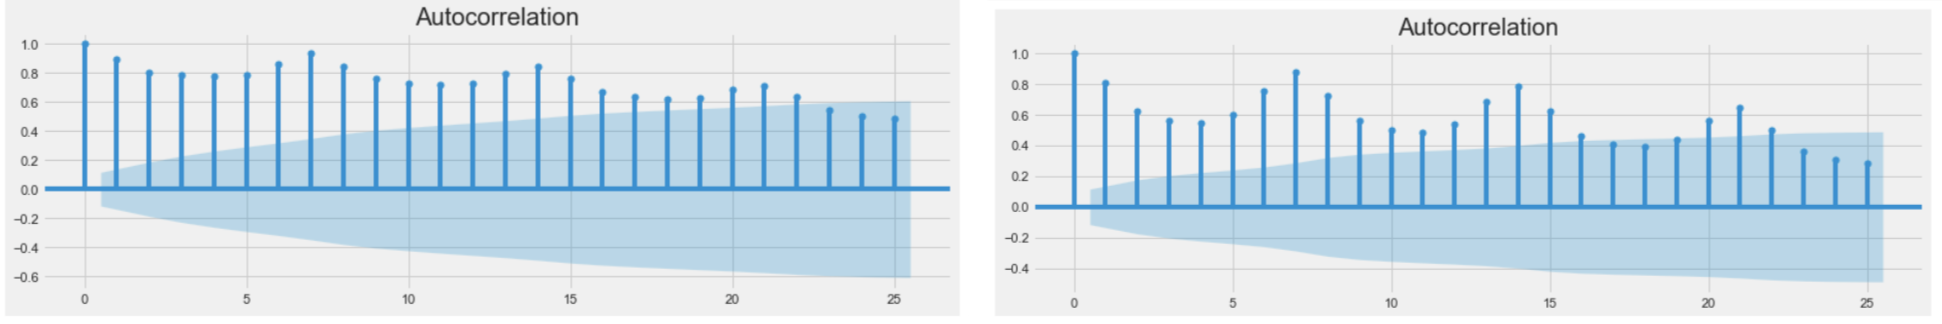
Moreover, the ACF plot for cases number (left) and deaths number (right) of the whole United States also verified that our data were weakly cyclical.
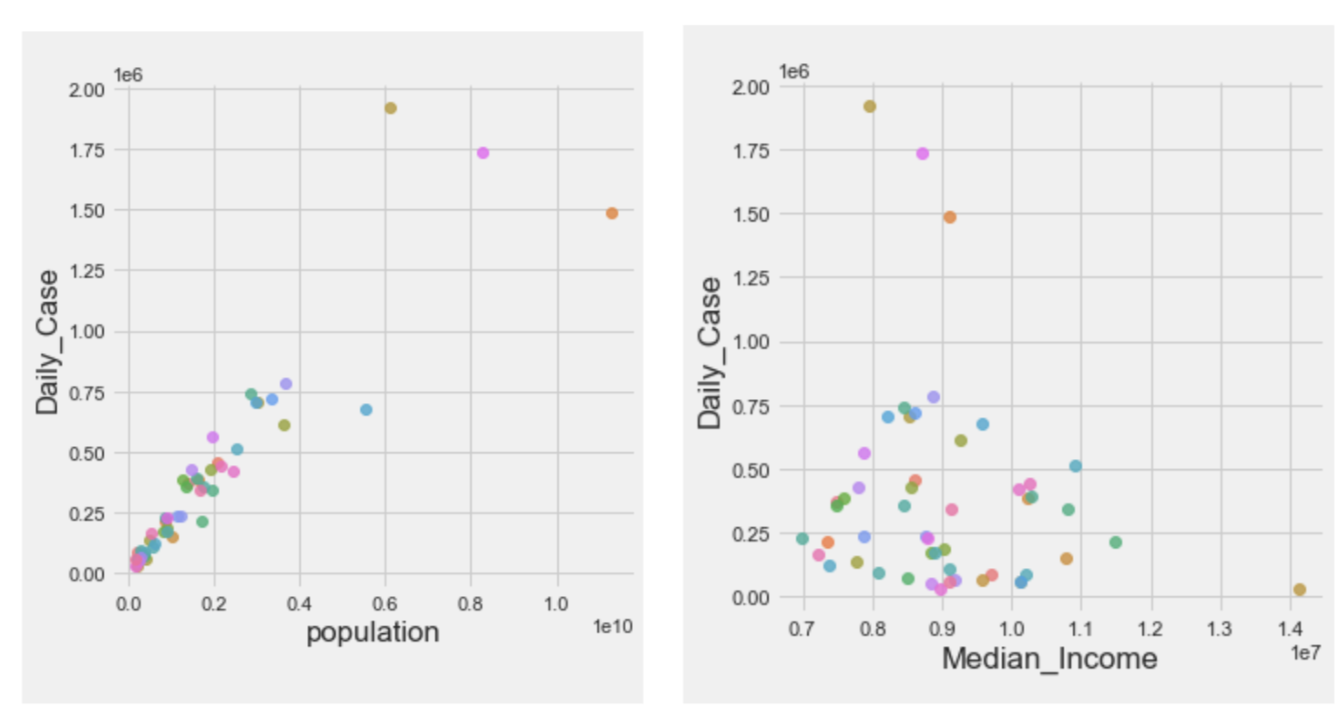
 Besides, parts of EDA plots are also shown above. We explored the relation between daily case mean and population and median income. Based on the plots, we found population did contribute to the prediction of the number of daily cases, while median income showed weak positive relation with the mean of daily cases.
Feature Engineering
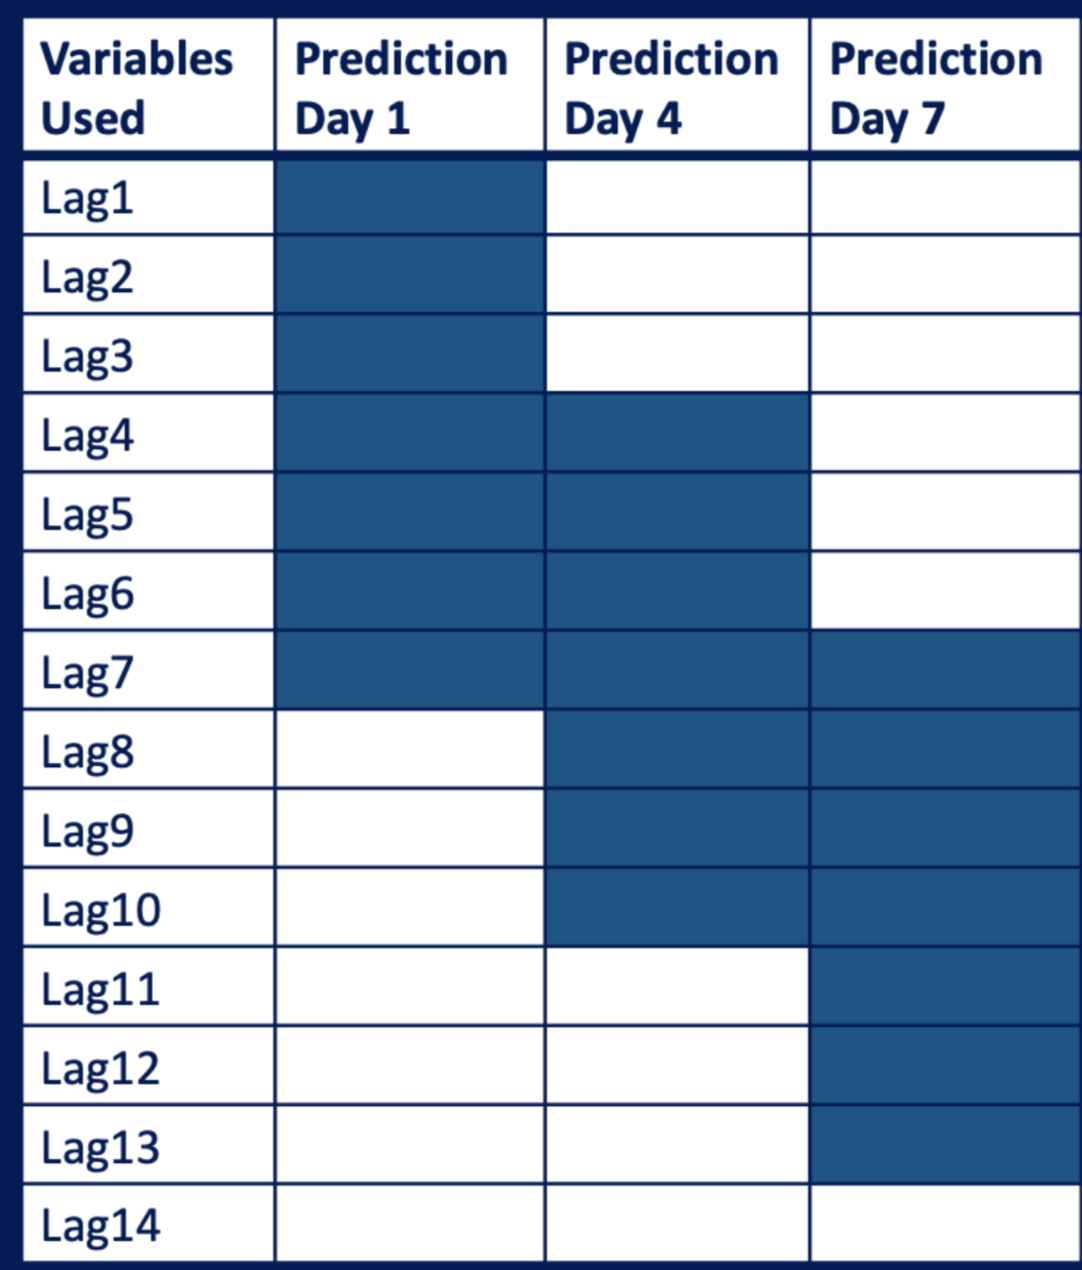
Inspired by the EDA, we intuitively add lagged data as our new features. In all our predictors, daily confirmed cases, daily deaths, number of people fully vaccinated and number of people who got tested are all time series data. Therefore, we tried to add lagged data of those predictors. Since we want to build 7 models on each day of the coming 7 days, we generated 7 dataframe for each model. A table below could help to illustrate our strategy. For example, if we want to train a model to predict the number of confirmed cases of the fourth day in the coming 7 days, we used a dataframe where time-series predictors were lagged from 4 days to 10 days.
Modeling
After gathering the data and feature engineering, the modeling process began. After reading some literature and reviewing a few Kaggle competitions. We found boosting tree model and random forest model are two of the most prevalent algorithms when forecasting Covid-19 cases and death numbers. Therefore, the two algorithms just mentioned could be a good starting point for this project.
Random Forest
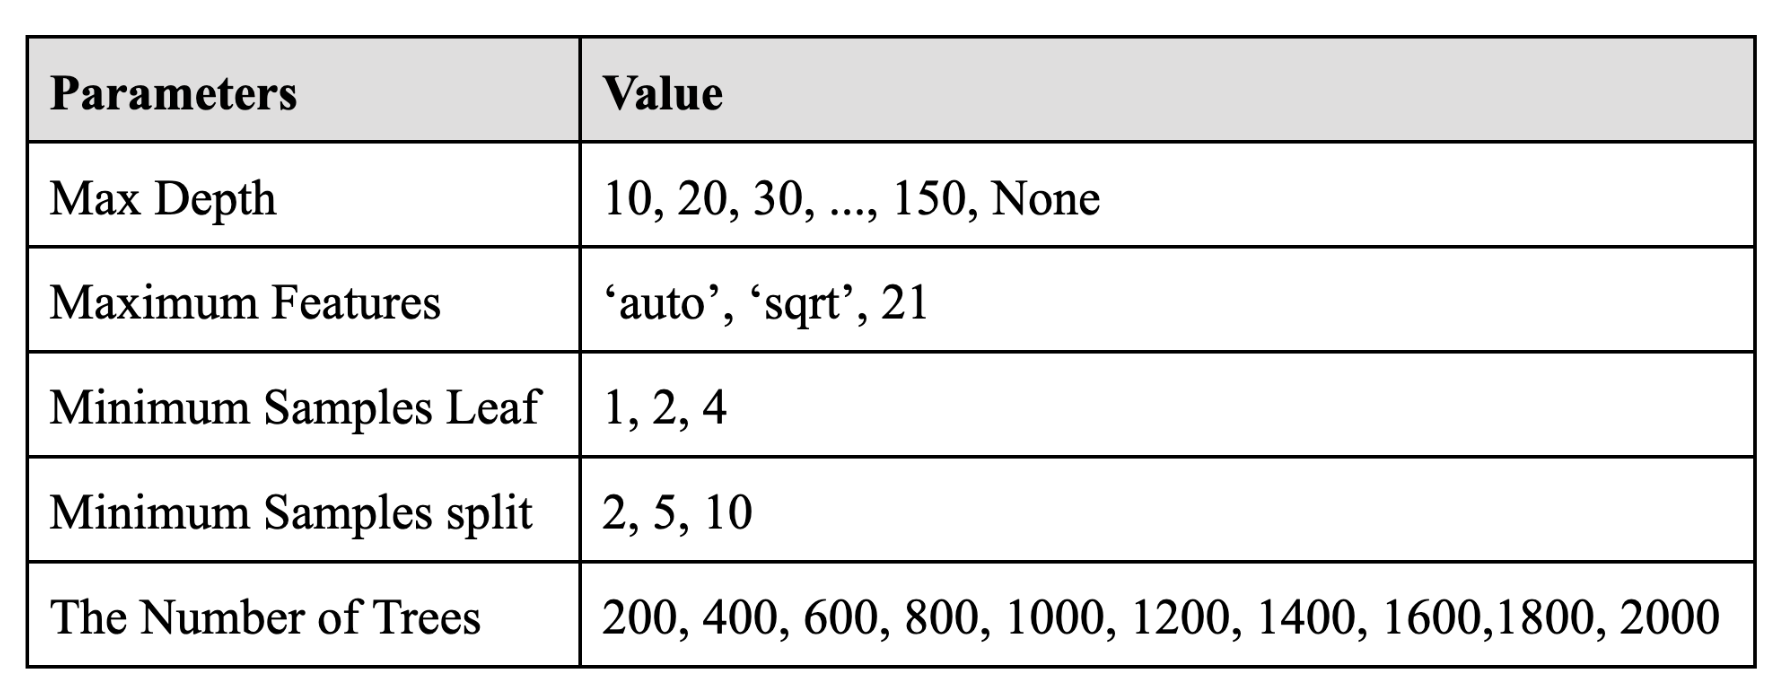
For the Random Forest model, we first simply tried to train the model for case number prediction of the first day by using default parameters. The RMSE of this model was about 728.8, which could be improved. Therefore, we tried to do hyperparameter tuning. The most important parameters in the Random Forest Model are the number of trees in the forest (n_estimators) and the number of features to consider when looking for the best split (max_features). Thus, we would focus on those two parameters when tuning. The optimal value max_features was actually strictly proved that it should be about the number of parameters divided by 3, which resulted in 21 in our case. We would verify that as well. The table below showed the parameter we tried.
 For the sake of time cost, we first used randomized search cross validation and the best parameter combination was that 400 for the number of trees, 2 for minimum samples split,
 1 for minimum samples leaf, 21 for maximum number of features, and no limit for maximum depth.
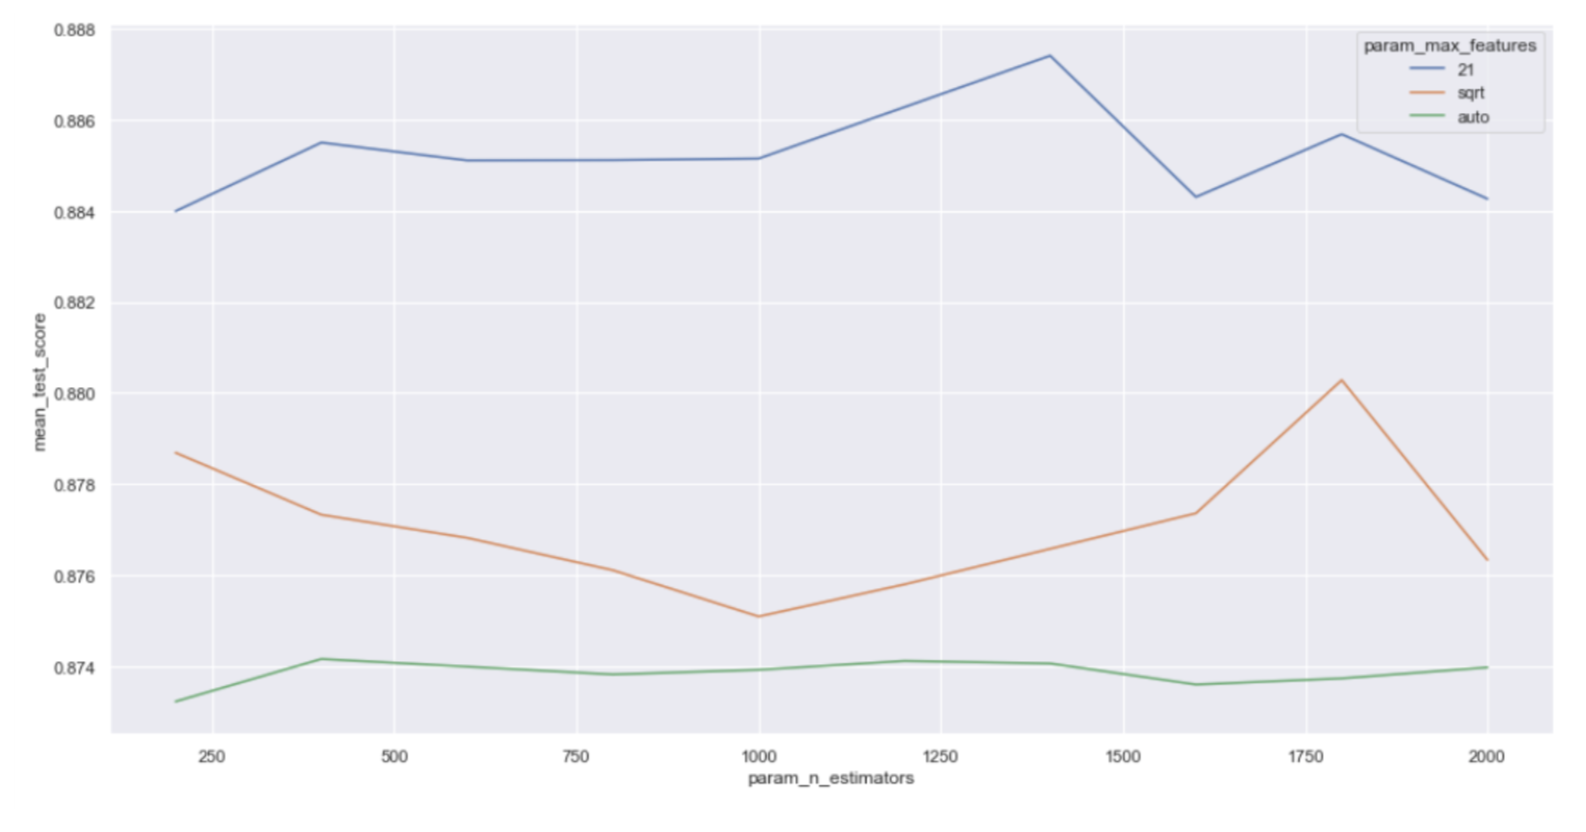
For the two important parameters, based on the plot below, we found that the optimal number of features was indeed 21, while the number of trees did not have a significant impact on the model performance, which should hold for all 14 models. Therefore, we then tried grid research cross validation to further optimize the parameters. Finally, our final choice for parameters was 1000 for the number of trees, 20 for number of features, 1 for minimum sample leaf and 3 for minimum samples split.
XGBoost
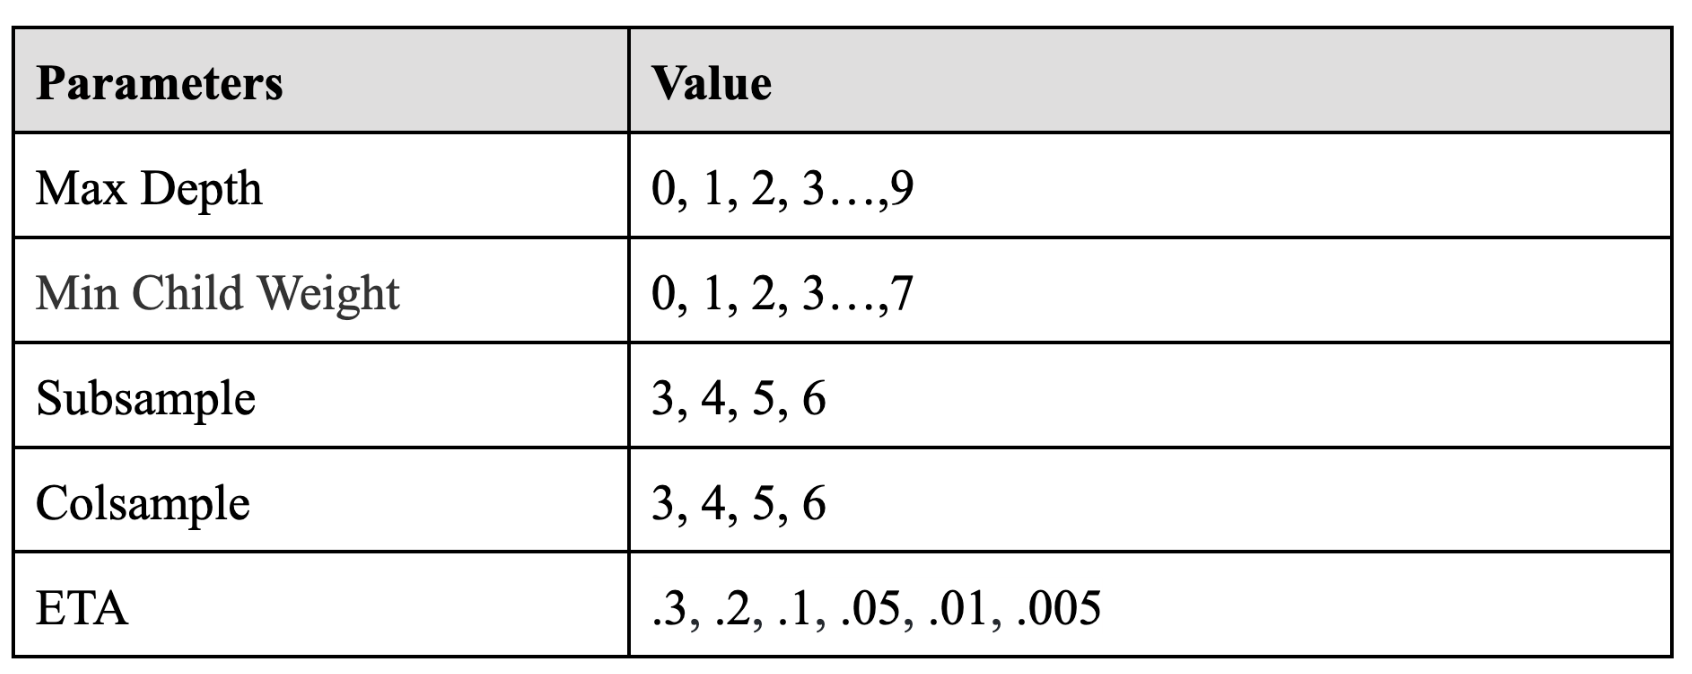
For the XGBoost model, we firstly train the model 1 (1st day) for daily cases in the training dataset by default parameters. The RMSE of this model was about 810.4, which needed to be decreased. Therefore, we decided to start model parameter tuning for XGBoost. The parameters needed to tune are max_depth, min_child_weight, subsample, colsample, ETA. We use a grid-search method to tune these parameters. The table below showed the parameter we tried.
 After a time-consuming tuning process, we finally reached the optimal parameters for this XGBoost model ( max_depth: 4, min_child_weight: 2, subsample: 0.6, colsample: 0.6, ETA: 0,05 ), which have decreased the RMSE to 661.5. Also, we did the same tuning process for the following models and calculated the best parameters for each model.
With the best parameters for each model, we fit the XGBoost models and calculate RMSEs for future comparison and evaluation.
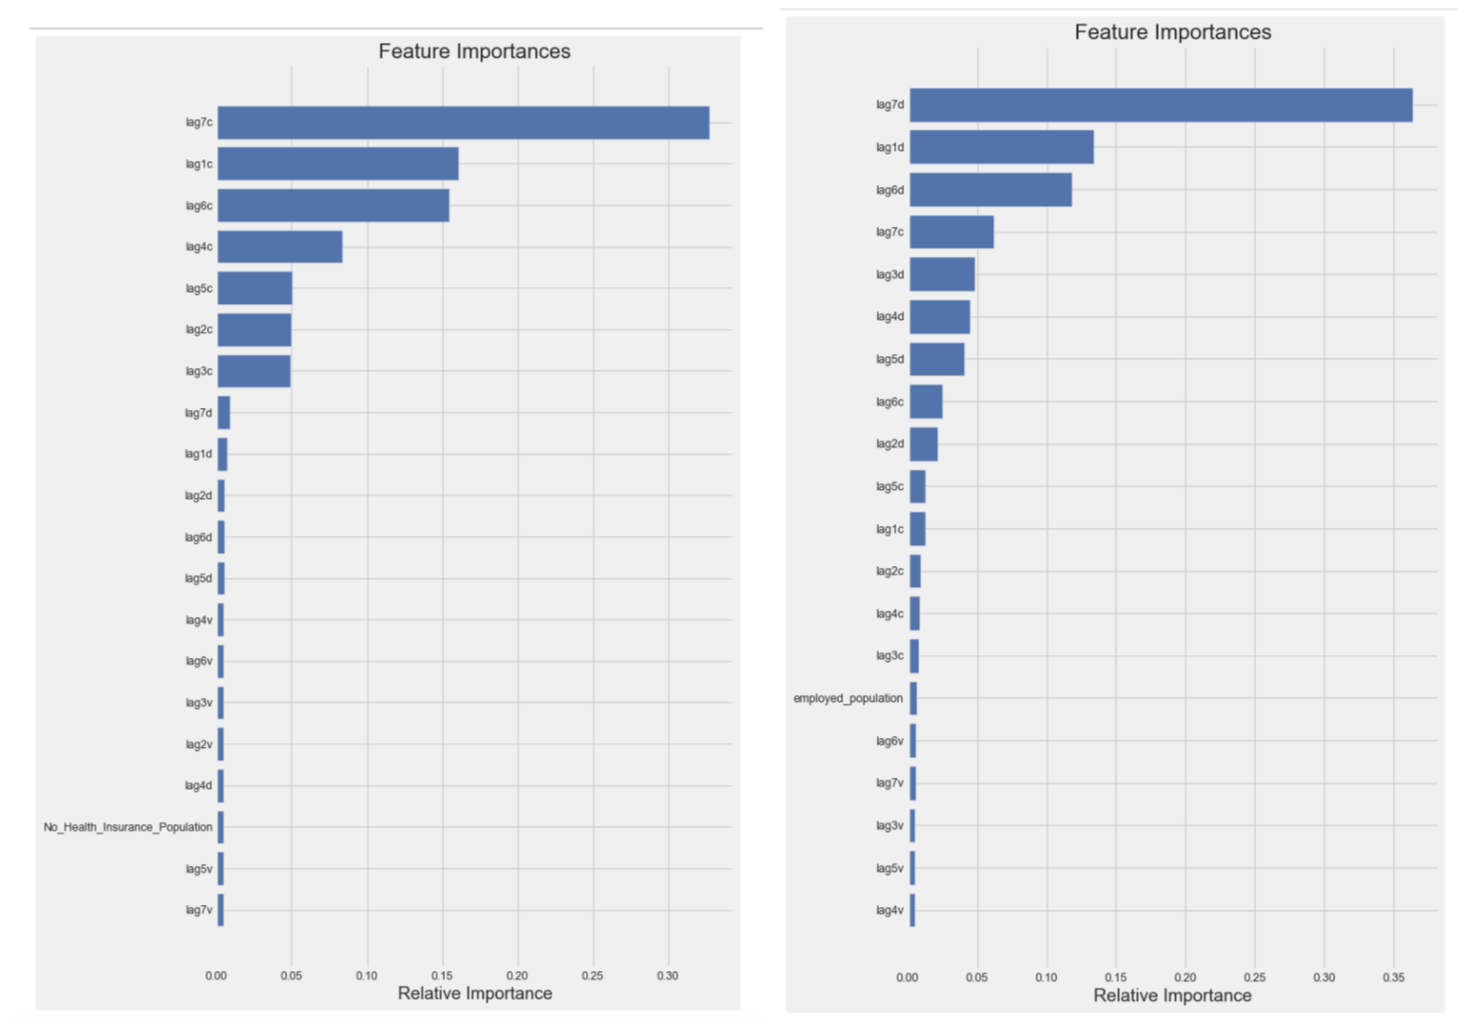
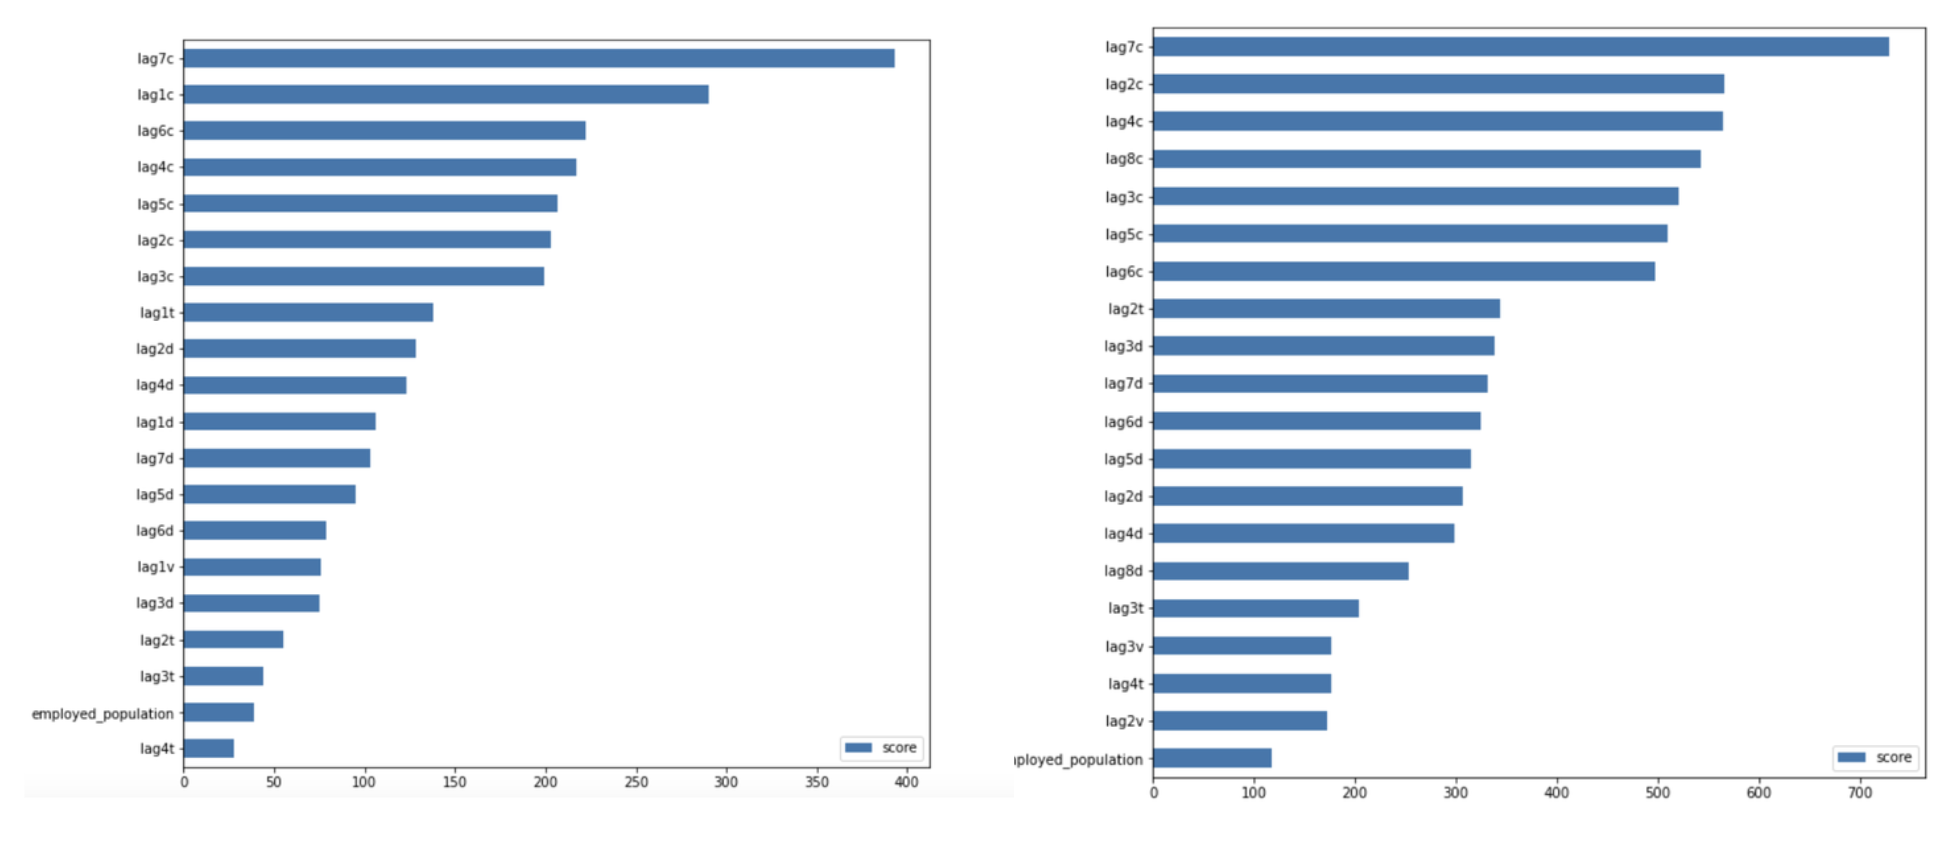 Also, two importances plots are shown above, indicating that the numbers of cases and deaths were significantly weekly cyclical in that 7 days lagged data was the most important predictors in all XGBoost models, which is the same result as random forest models.
Model Evaluation and Comparison
The figures following are the comparison of XGBoost and Random Forest by RMSE in each model.
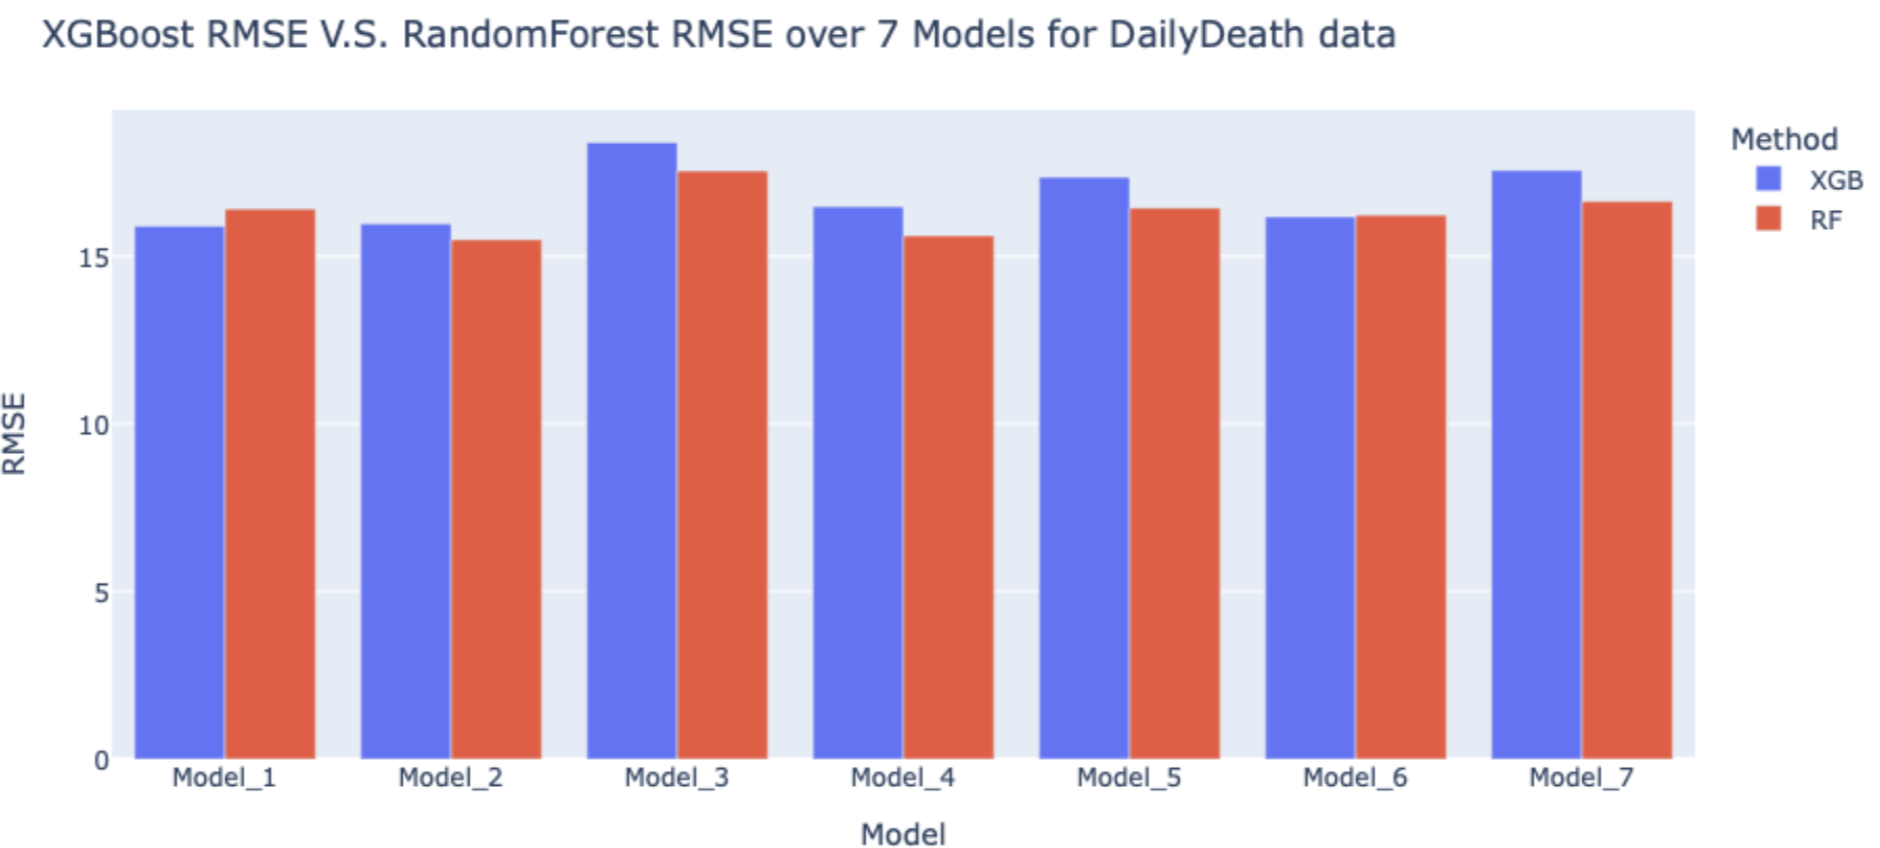
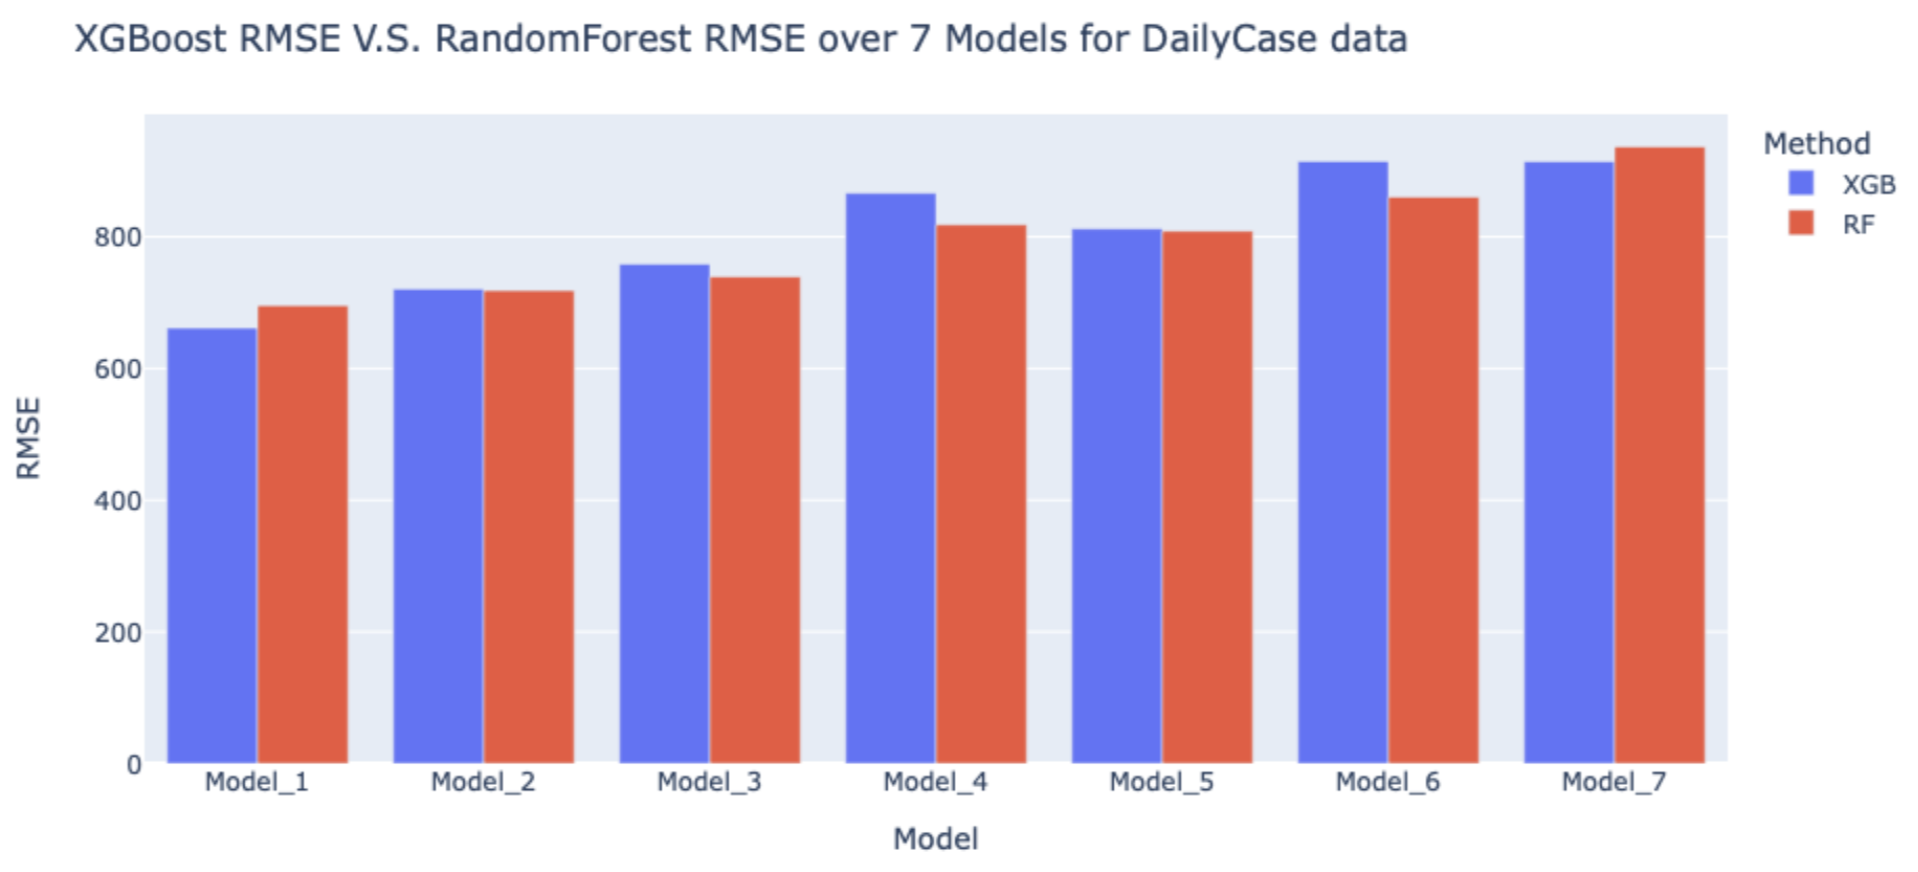 Although the RMSEs for XGBoost models and Random Forest models for daily cases are all higher than 600, given that the number of COVID cases each day is high, these RMSEs are acceptable.
As we can see in the figures, most of the RMSEs for Random Forest are higher than XGBoost, which means Random Forest models have a better performance in prediction of daily cases and deaths. Therefore, we decided to use Random Forest in the validation dataset to predict the COVID-19 cases and deaths in the following week (11/15~11/21).
Model Validation
Our final prediction results are as following:
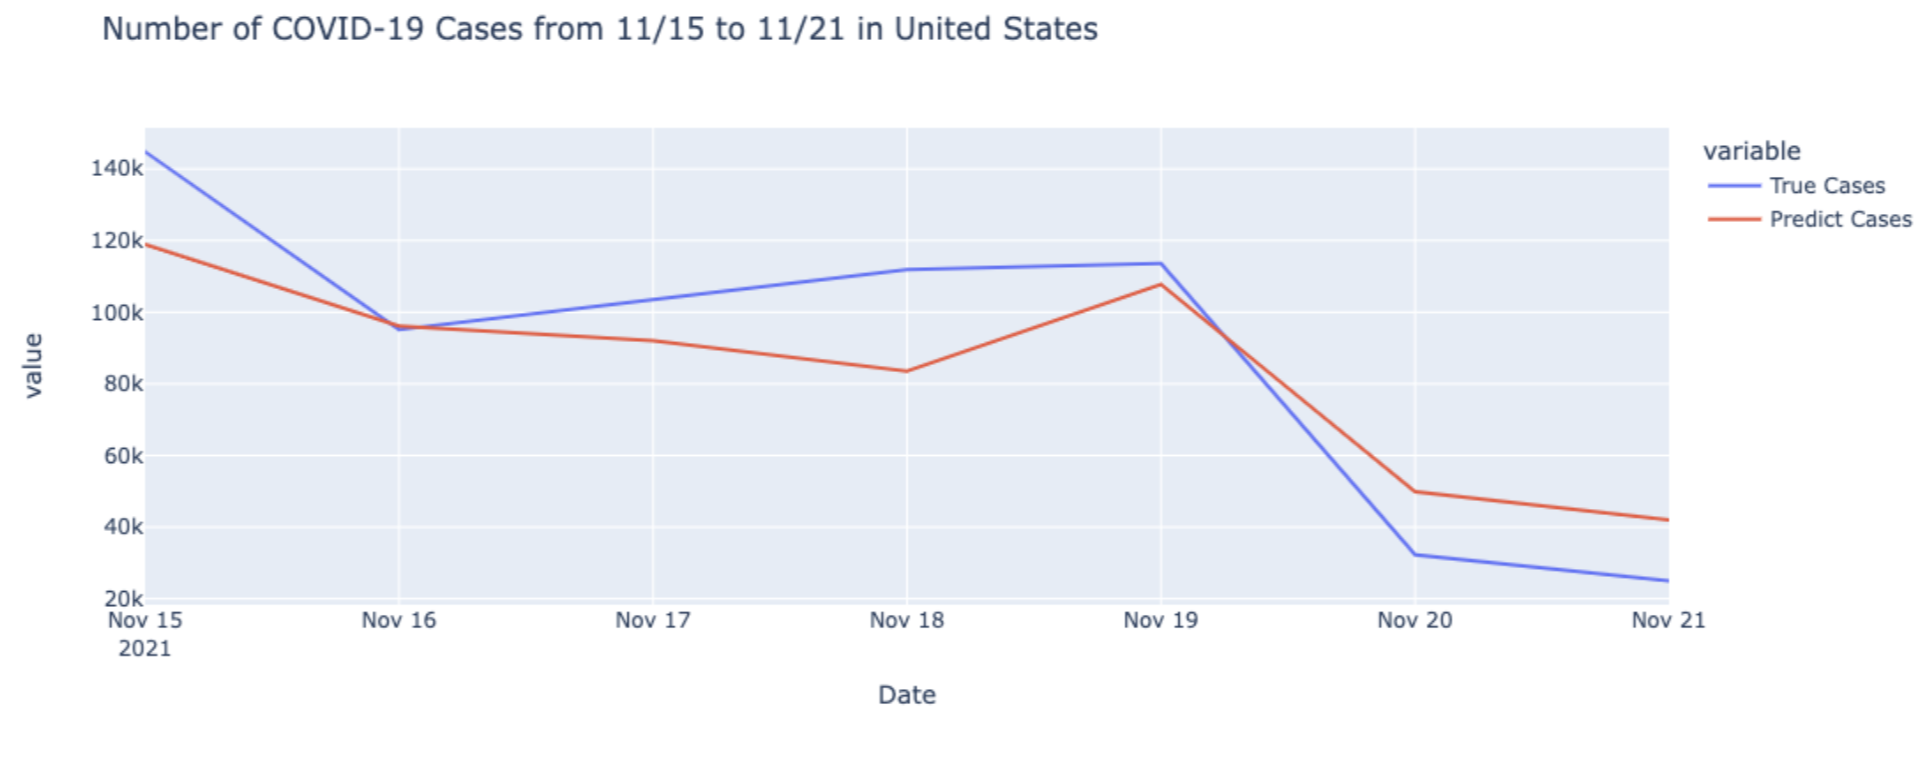
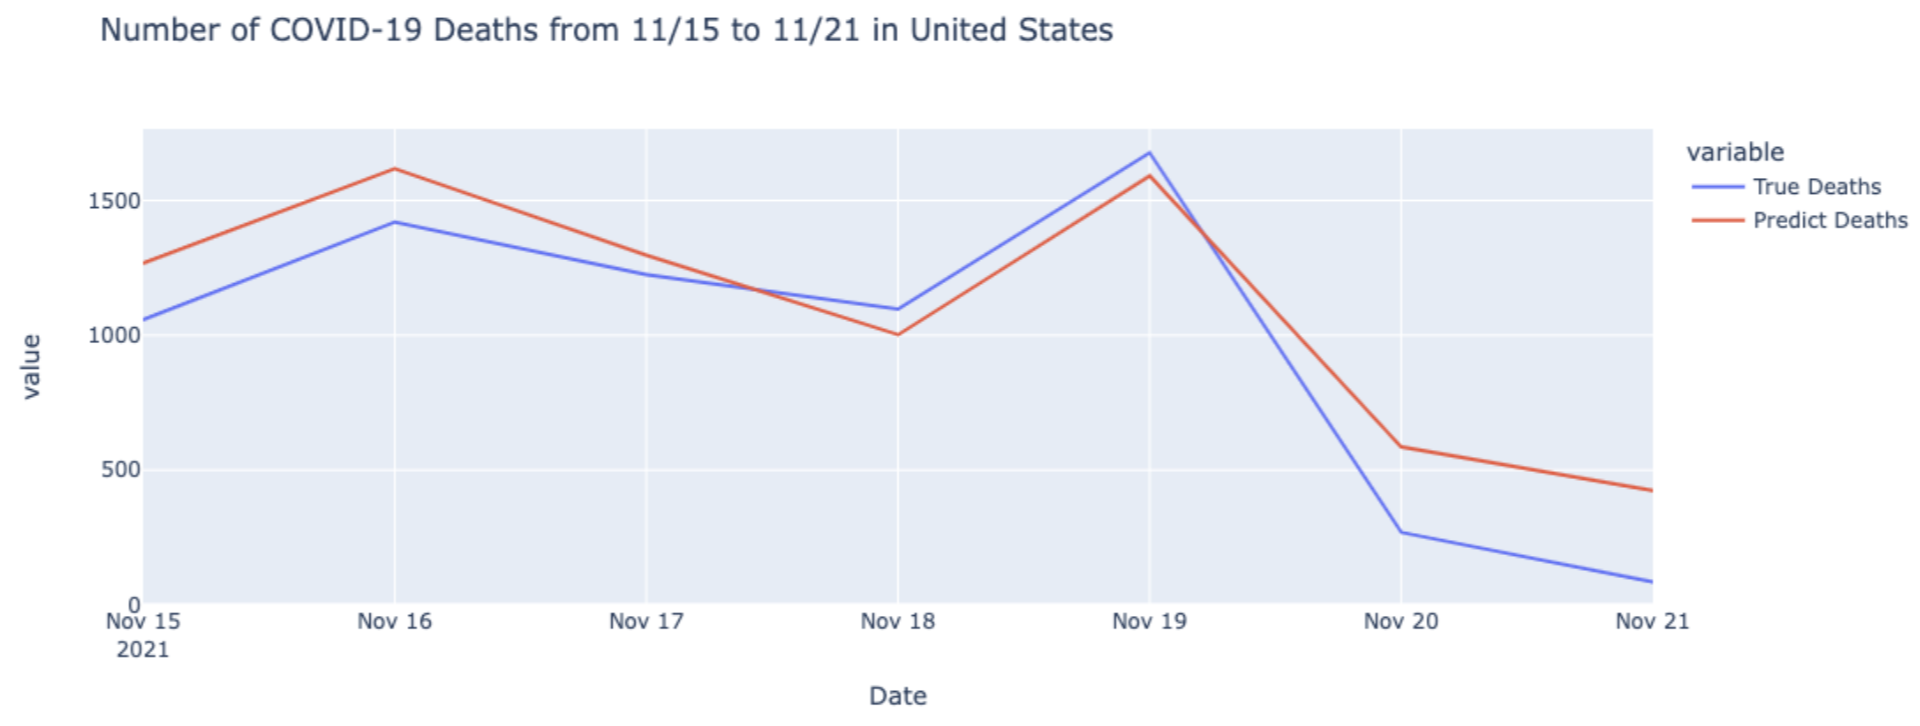 In the figures above, after comparing with the true value of COVID cases and deaths from CDC, we can see that our models make an accurate prediction on cases and deaths of COVID-19.
Discussion and Summary
In this project, as shown above, our forecast results for the whole United state were considerably good. However, if we instead focused on the forecast in each state, there should be more variance and the prediction of some state may not be as good as that of the whole United State. However, this should be reasonable and acceptable as some states had pretty small numbers for confirmed cases and deaths, sometimes even as small as 0. Besides, we may not need to worry about that as our RMSEs from cross validation were acceptable. Therefore, people should be able to get a good forecast for the future number of Covid-19 cases and deaths, especially at the national level.
There are still a lot of things that we can continue working on. First, we considered the seasonal characteristics of the time series data by using 7 models, but we did not consider the trend of the time series mode as the data in some states are not stationary. For those non-stationary data, we may consider using some strategies in ARIMA like differencing. Besides, our model might not have good performance in long term forecasts as we have to use what we predicted as input of our models to continue predicting the future number of cases and deaths.
Individual Contributions
- In this project, My first contribution is to do some literature review, finding out that completed vaccine data are significantly related to our interested outcomes. In this case, I found out the U.S. total completed vaccinated data, and merged the vaccine data with our main dataset.
- In the second part, Caihan and I have generated the daily new cases and daily new deaths from the CDC website.
- The Third part is I was responsible for the modeling of XGBoost daily death cases prediction. I cleaned the main data set and prepared the data for modeling. Used Cross Validation method to tune the best parameter for the XGBoost model. The tuned parameters included {colsample_bytree, eta, max_depth, min_child_weight, subsample}. The parameters: eval_metric and objective are all set as the default values. (the details are shown in the above modeling part)
- I also created the dash board structure, built the dashboard, and deployed it to the Heroku public website. In the dashboard construction part, I also created the RMSE XGBoost vs Random Forest histogram and the plot of Random Forest predicted result.
Gained Experience and Learning
Through this project, the first thing I learned is to pay more attention on the data cleaning part. In this project, after we have all trained the model, I discovered that there was a problem with the data we initially cleaned. In the data originally downloaded from the CDC, the content in the file named as Washington are all data in Virginia. Thus, we missed the data in Washington and got two records in virginia. We had to clean the data train the model again, which took much more time than we expected.
The second thing I learned is that the significance of tunning the model parameters. I first used all default parameters in the XGBoost model, the results were not satisfied. After using cross validation method to tune the parameters, the results are more precise. Though tunning the model is a time consuming thing (cross validation may take many hours), it is worth.
The third thing is to practice the communication sills. Our model prediction strategy (lag1 day ~ lag7 day) is quite confusing, we spent some time to try to explain it in the report more clearly.
Finally, developing a clean and readable dashboard is also a challenge thing. Need to spend more time thinking about what data I need to look at from the user’s point of view, how the expression of the data allows me to better understand the data, etc.